Visualising PDBe Data (Structural coverage and ligand interactions)
This example demonstrates how to display both the PDB structural coverage and specific ligand interaction sites for a protein, using data fetched from the PDBe. We’ll also include a CustomTrack to show how user-defined annotations can be overlaid.
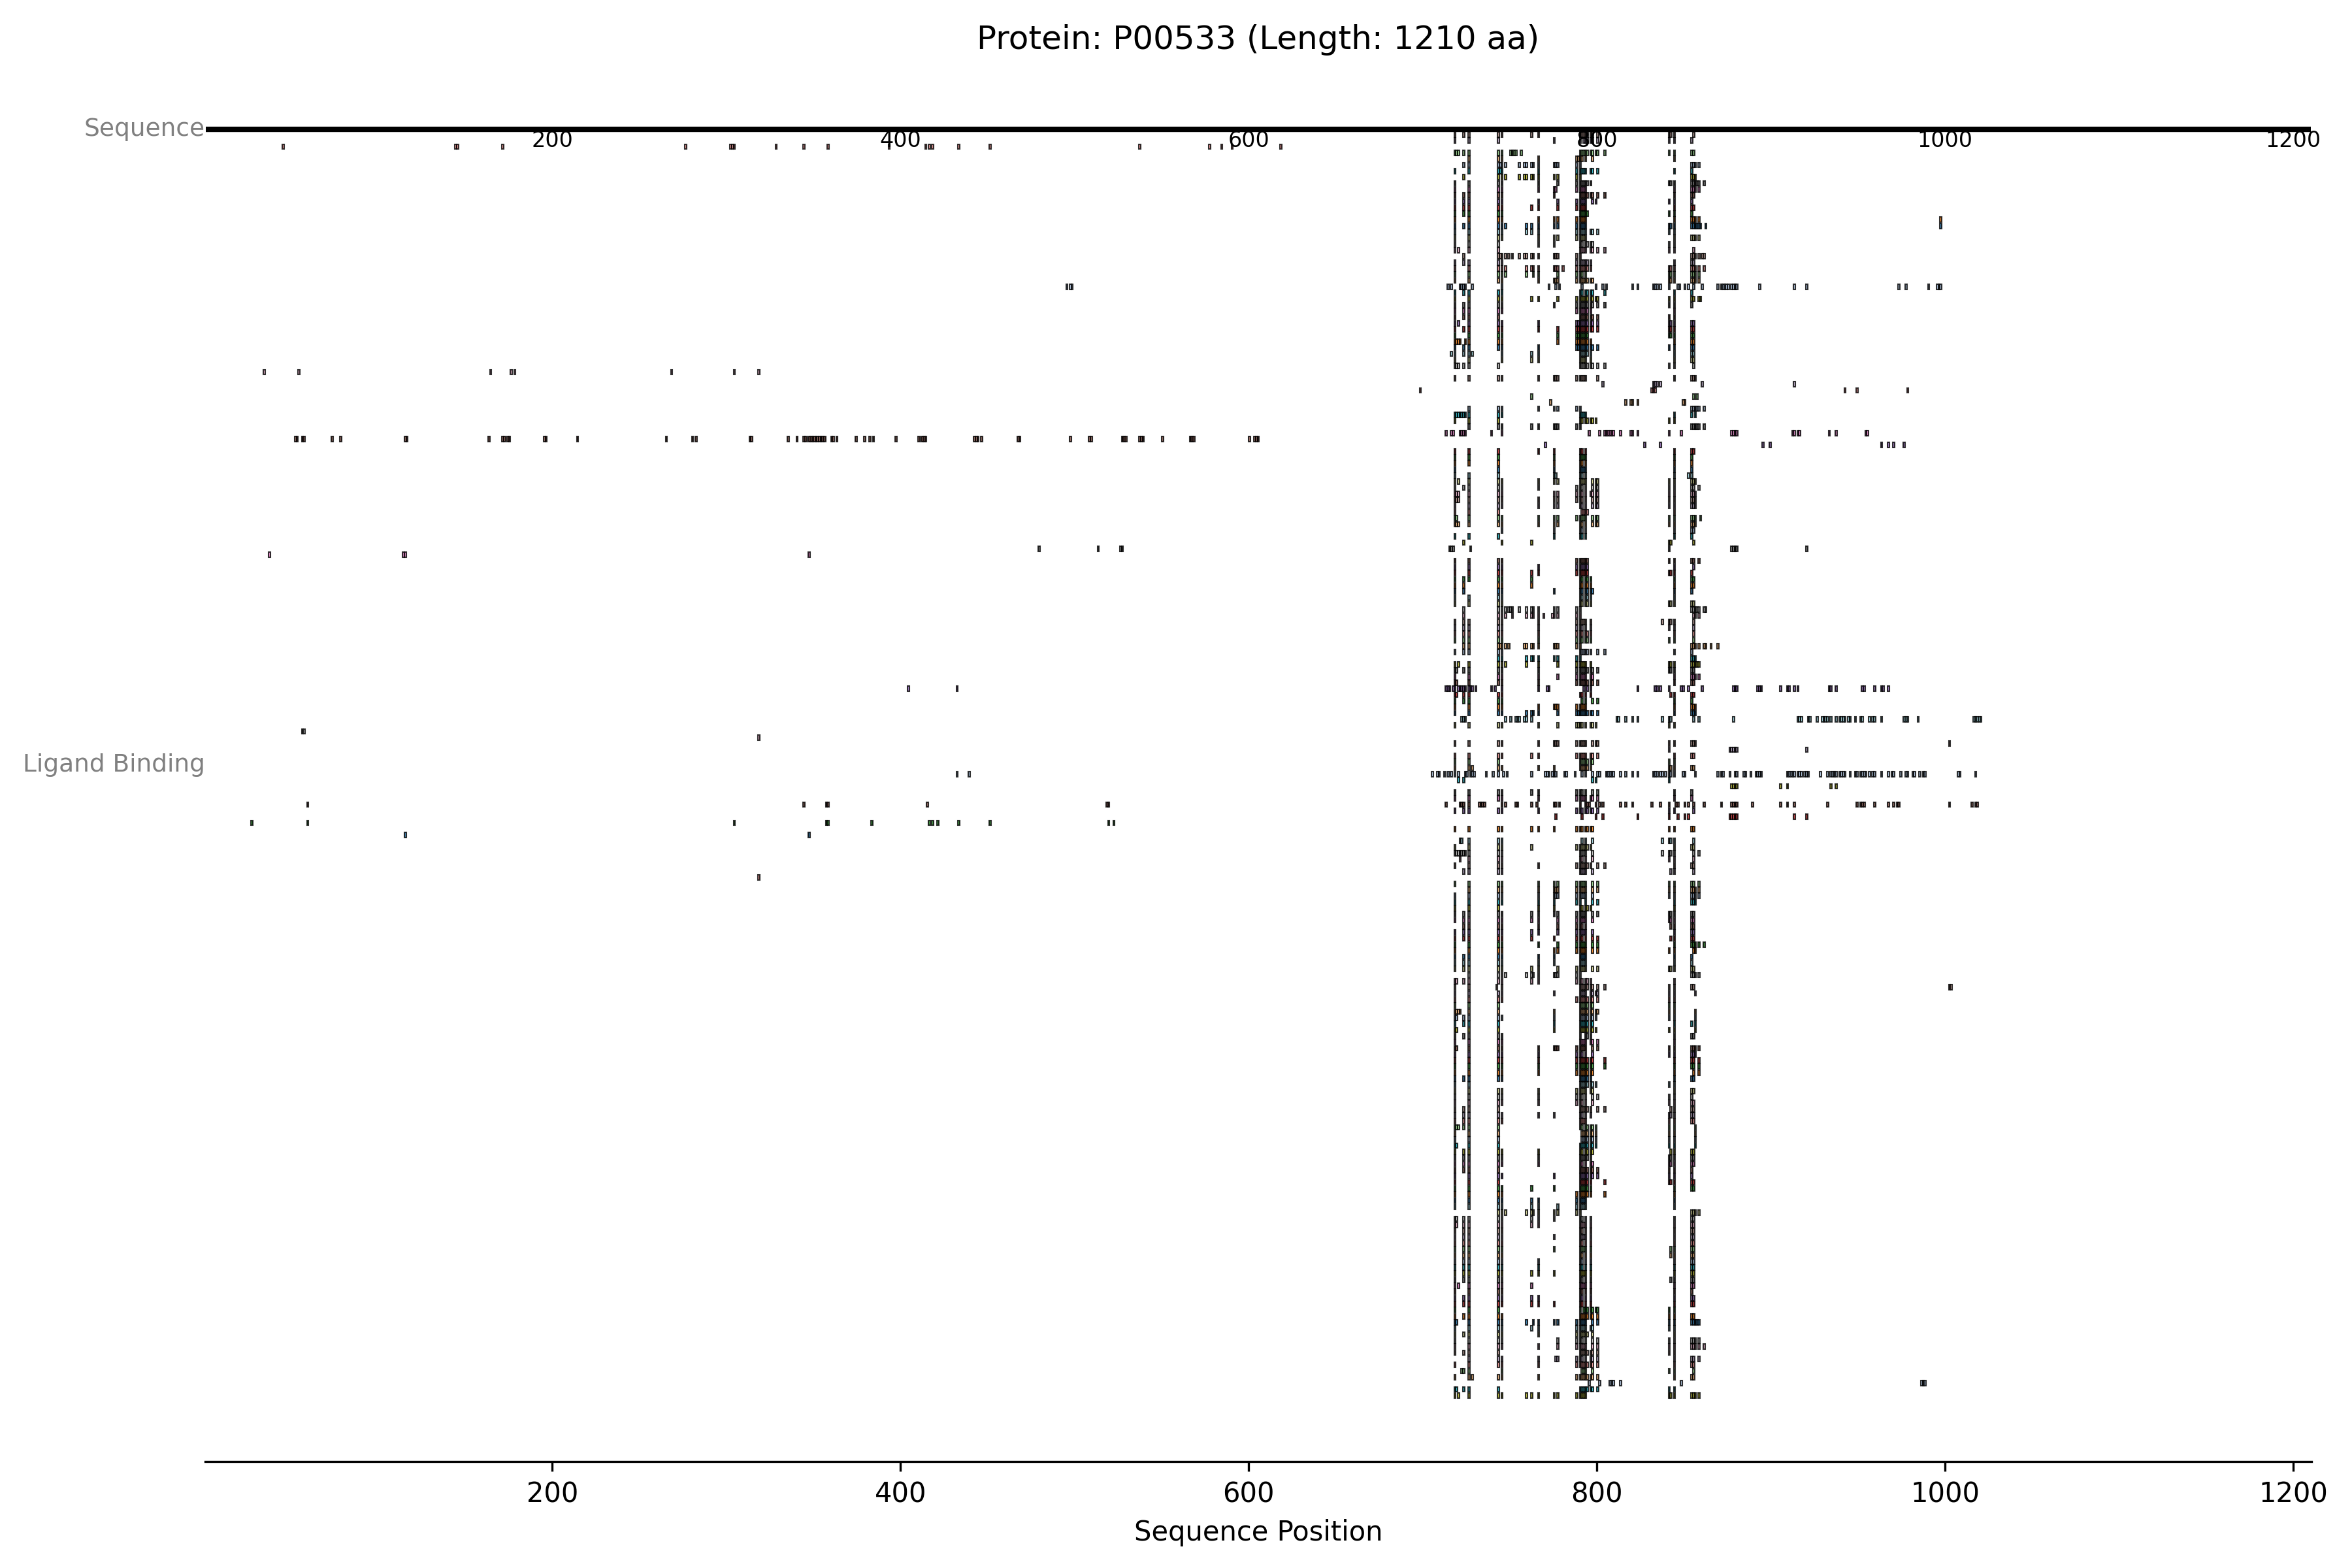
This script fetches PDB coverage and ligand interactions for the specified UniProt ID (EGFR, P00533). It then creates:
- An
AxisTrackfor sequence context. - A
PDBTrackin “collapse” mode to show overall structural coverage. - A
LigandInteractionTrackin “full” mode to detail individual ligand binding sites. - A
CustomTrackto overlay user-defined annotations, such as key functional sites or approximate domain boundaries. The resulting plot provides a multi-layered view of structural features and ligand binding relative to the protein sequence and custom points of interest.
from protviz import plot_protein_tracks
from protviz.data_retrieval import PDBeClient, get_protein_sequence_length
from protviz.tracks import AxisTrack, LigandInteractionTrack, PDBTrack, CustomTrack

def main():
    uniprot_id = "P00533" # EGFR - a receptor tyrosine kinase with many PDB entries and ligands
    pdbe_client = PDBeClient()

    try:
        seq_length = get_protein_sequence_length(uniprot_id)
        print(f"Sequence length for {uniprot_id}: {seq_length}")

        # Fetch ligand interactions
        ligand_interaction_data = pdbe_client.get_pdb_ligand_interactions(uniprot_id)
        if ligand_interaction_data:
            print(f"Found {len(ligand_interaction_data)} ligand interaction contexts.")
        else:
            print(f"No ligand interaction data found for {uniprot_id}.")

        # Create tracks
        axis_trk = AxisTrack(sequence_length=seq_length, label="Sequence")


        ligand_trk_detailed = LigandInteractionTrack(
            interaction_data=ligand_interaction_data,
            label="Ligand Binding",
            plotting_option="full", # Show each ligand separately
            show_ligand_labels=False,
            site_height=0.5, # Adjust height for clarity if many ligands
        )

        # Plot all tracks
        plot_protein_tracks(
            protein_id=uniprot_id,
            sequence_length=seq_length,
            tracks=[axis_trk, ligand_trk_detailed],
            figure_width=12, # Adjust width as needed
            figure_height = 8,
            save_option=True
        )
        print(f"PDBe example plot saved as {uniprot_id}_plot.png")

    except Exception as e:
        print(f"An error occurred during the PDBe example: {e}")
        import traceback
        traceback.print_exc()

if __name__ == "__main__":
    main()
The previous example will generate an image like this one: