Visualising TED Annotations
This example focuses on fetching domain annotations from the TED database and displaying them.
The script uses TEDClient to retrieve domain annotations for the given UniProt ID.
- An
AxisTrackis included. - A
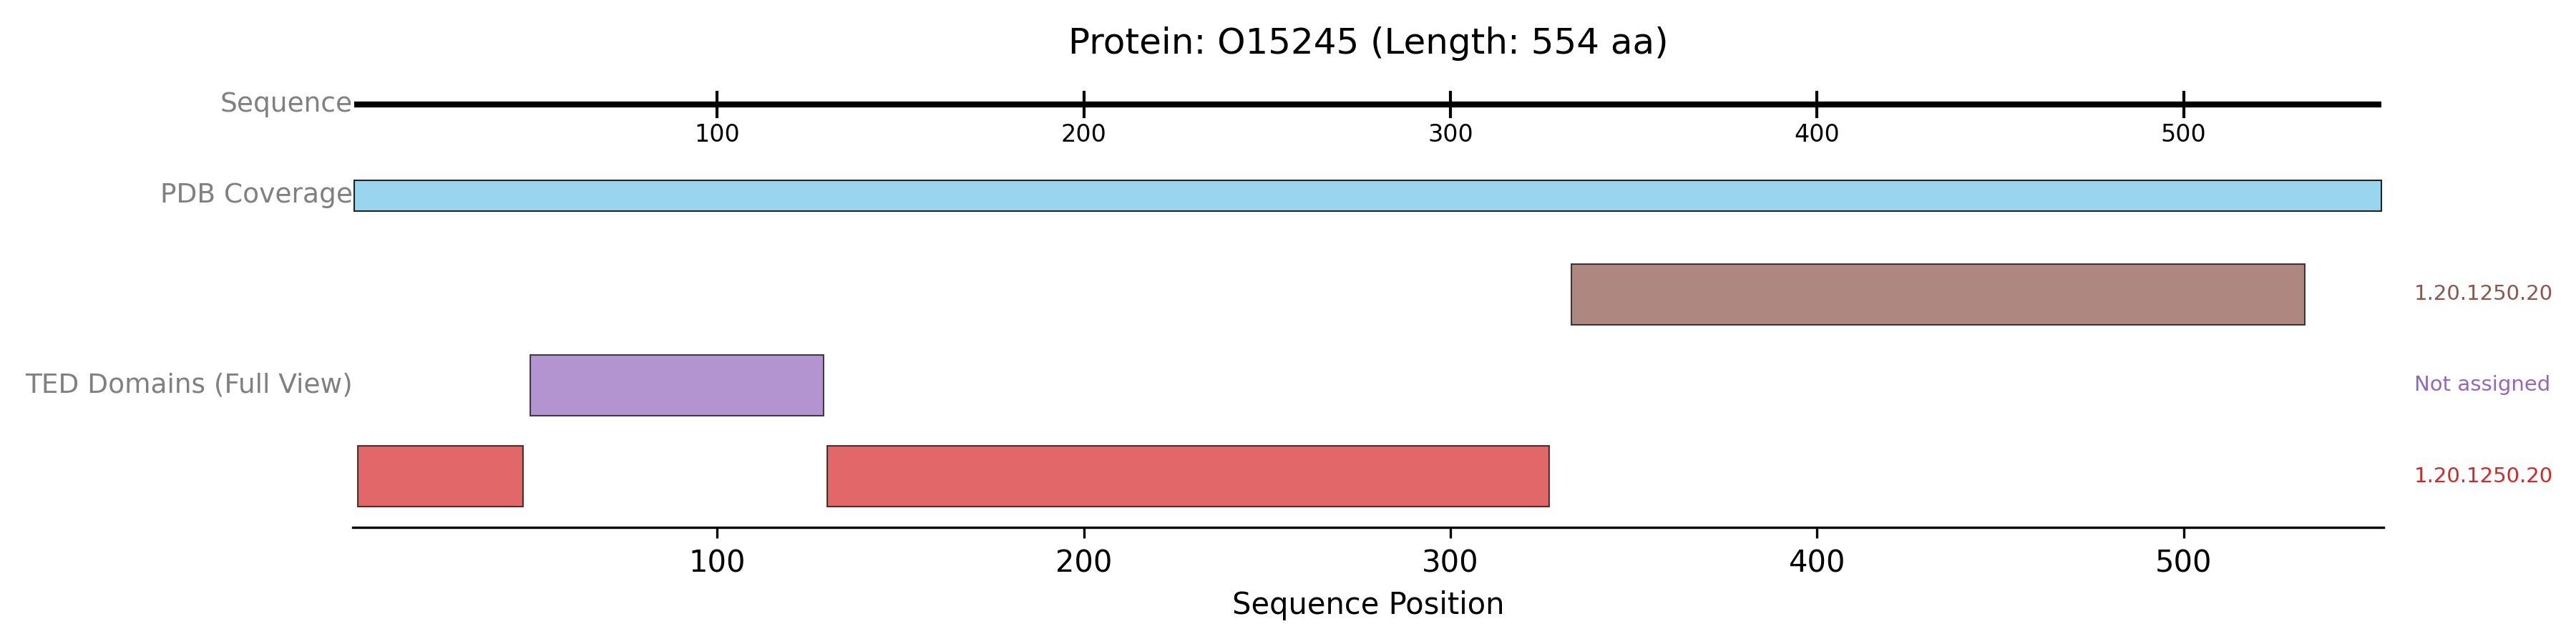
PDBTrackis added to show the PDB coverage, providing structural context to the TED domains. - The
TEDDomainsTrackis configured with plotting_option=”full” to display each distinct TED annotation (which may itself comprise multiple segments) in a separate, uniquely coloured lane. show_domain_labels=True ensures that CATH labels associated with these domains are displayed.
from protviz import plot_protein_tracks
from protviz.data_retrieval import TEDClient, get_protein_sequence_length, PDBeClient
from protviz.tracks import AxisTrack, TEDDomainsTrack, PDBTrack # Added PDBTrack for context

def main():
    uniprot_id = "O15245" # Example UniProt ID with TED annotations
    ted_client = TEDClient()
    pdbe_client = PDBeClient() # For adding PDB context

    try:
        seq_length = get_protein_sequence_length(uniprot_id)
        print(f"Sequence length for {uniprot_id}: {seq_length}")

        # Fetch TED annotations
        ted_domain_annotations = ted_client.get_TED_annotations(uniprot_id)
        if ted_domain_annotations:
            print(f"Found {len(ted_domain_annotations)} TED domain annotations.")
        else:
            print(f"No TED annotation data found for {uniprot_id}.")

        # Fetch PDB coverage for context
        pdb_coverage = pdbe_client.get_pdb_coverage(uniprot_id)

        # Create tracks
        axis_trk = AxisTrack(sequence_length=seq_length, label="Sequence")

        pdb_context_trk = PDBTrack(
            pdb_data=pdb_coverage,
            label="PDB Coverage",
            plotting_option="collapse"
        )

        ted_domains_trk_detailed = TEDDomainsTrack(
            ted_annotations=ted_domain_annotations,
            label="TED Domains (Full View)",
            plotting_option="full", # Show each TED annotation in its own lane
            show_domain_labels=True # Display CATH labels if available
        )

        # Plot the tracks
        plot_protein_tracks(
            protein_id=uniprot_id,
            sequence_length=seq_length,
            tracks=[axis_trk, pdb_context_trk, ted_domains_trk_detailed],
            figure_width=12,
            save_option=True
        )
        print(f"TED example plot saved as {uniprot_id}_plot.png")

    except Exception as e:
        print(f"An error occurred during the TED example: {e}")
        import traceback
        traceback.print_exc()

if __name__ == "__main__":
    main()
The previous example will generate a plot like this one: